

SI Program Statistics
The SI program collects and manages various forms of data on the impact and student perceptions for all courses offering SI support every semester. Comprehensive data sets are provided directly to the appropriate university stakeholders at the end of every semester (e.g., The Office of the Provost, college deans, department chairs, and individual funding source representatives). Individual section/faculty data sets are provided directly to faculty members at the start of each subsequent semester.
Interested in a specific data set for your class, department, or college?
Let's chat! We may be able to generate special quantitative and demographic reports upon request. Examples of special requests include First Gen SI comparison reports, graduation persistence data within specific cohorts of students, and voluntary vs. for-credit SI model comparison reports. Contact Stephanie Gonzalez (stephanie@txstate.edu) for special data requests.
Quantitative Reports
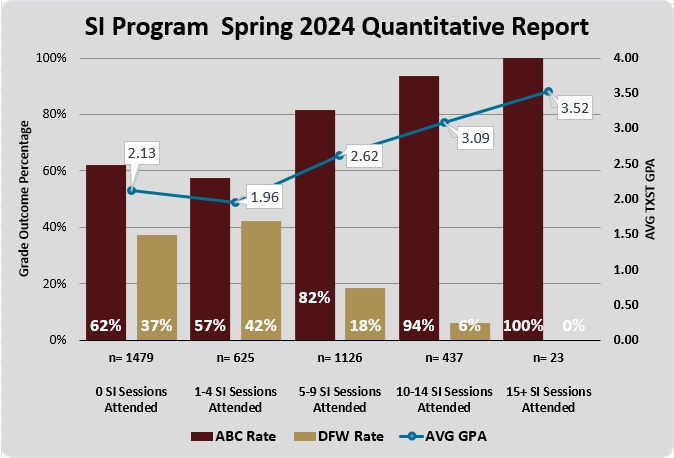
Quantitative reports include comparisons of A/B/C & D/F/W rates, as well as GPA differences between students who regularly participate in SI sessions and students who do not. These reports are generated using SI attendance records (via a reporting site developed by the Division of Information Technology) and the university's student records database system (Banner).
Data reports for the semesters below are available upon request.
| Fall 2018 | Spring 2019 |
| Fall 2019 | Spring 2020 |
| Fall 2020 | Spring 2021 |
| Fall 2021 | Spring 2022 |
| Fall 2022 | Spring 2023 |
| Fall 2023 | Spring 2024 |
Qualitative Reports

Qualitative reports include student evaluations and feedback on the SI program collected via an online survey at the end of every semester. These reports are generated using an anonymous online survey (via Qualtrics) distributed to all students enrolled in SI-supported courses.
Data reports for the semesters below are available upon request.
| Fall 2018 | Spring 2019 |
| Fall 2019 | Spring 2020 |
| Fall 2020 | Spring 2021 |
| Fall 2021 | Spring 2022 |
| Fall 2022 | Spring 2023 |
| Fall 2023 | Spring 2024 |
Demographic Reports
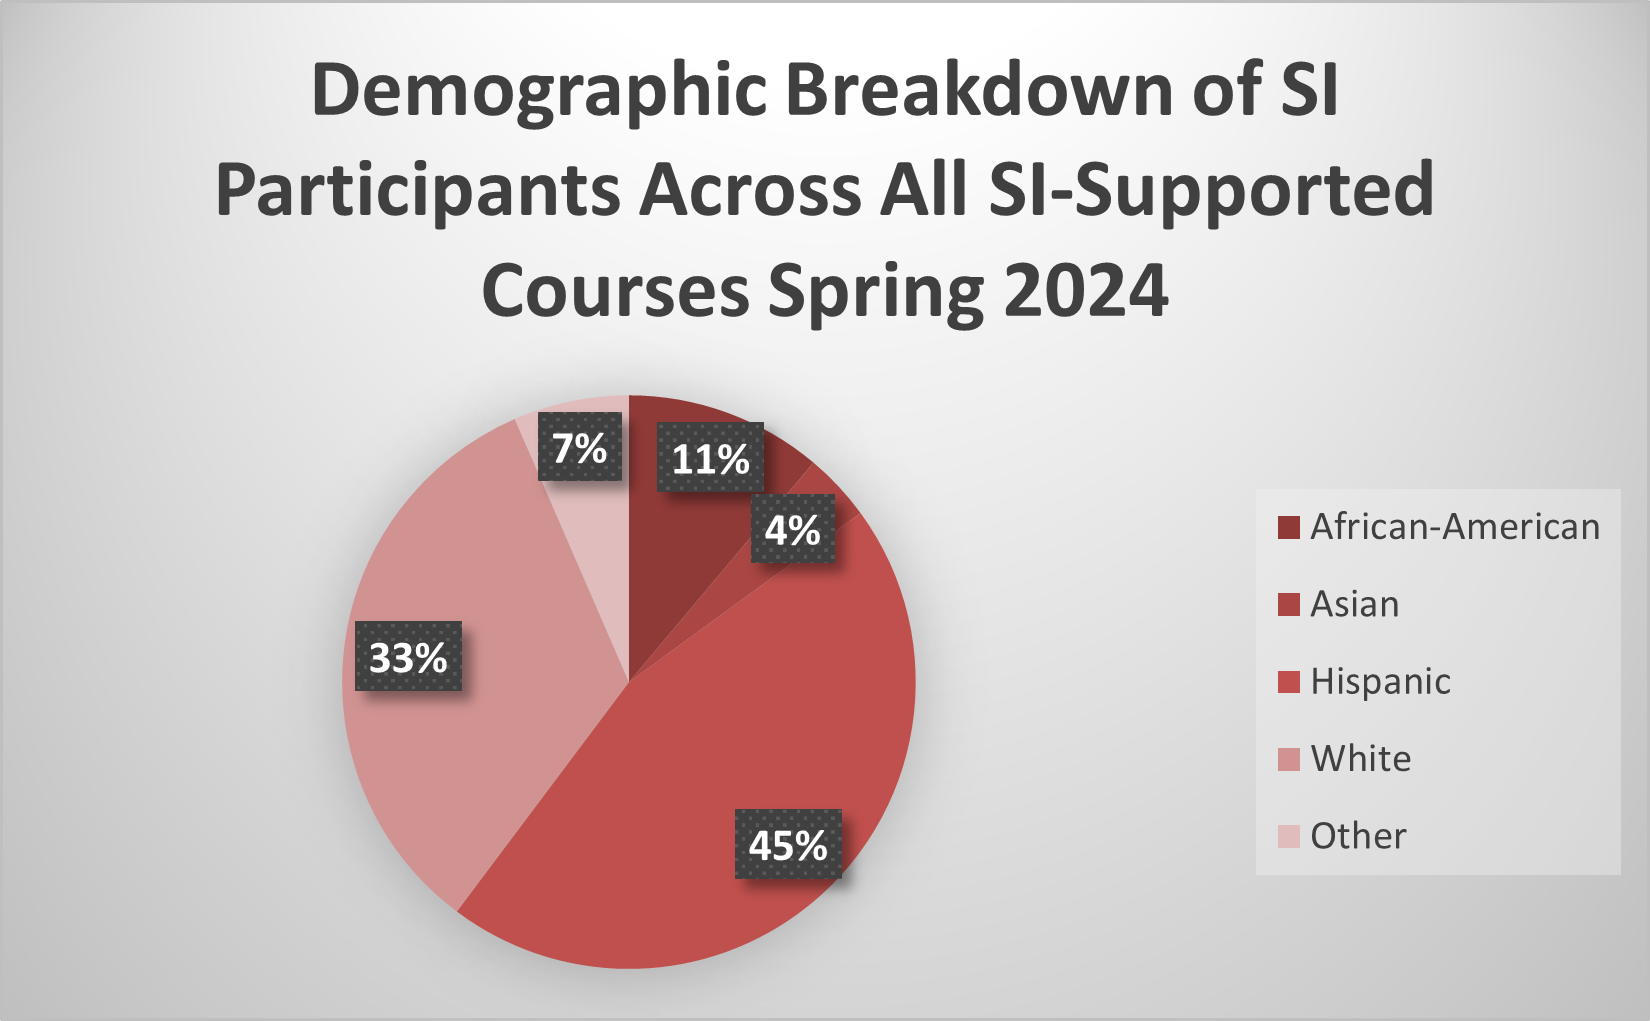
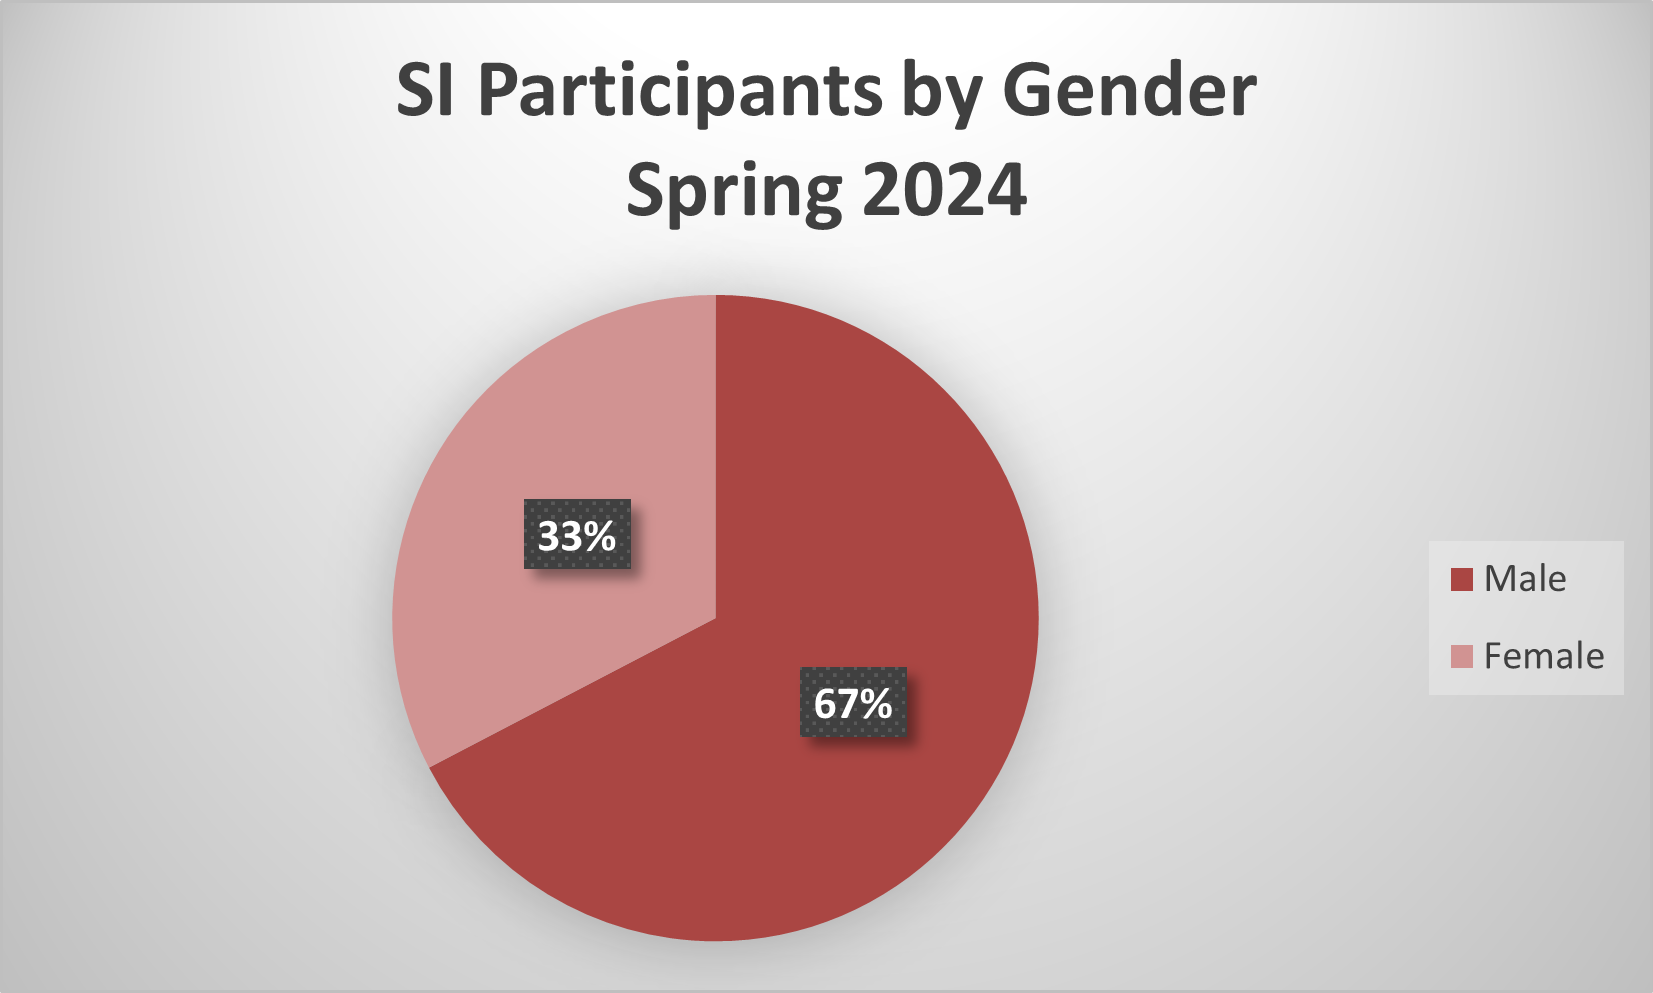
Demographic reports include data on student sex, race/ethnicity, and age range for various categories of SI participation. These reports are generated using SI attendance records (via a reporting site developed by the Division of Information Technology) and the university's student records database system (Banner).
Data reports for the semesters below are available upon request.
| Fall 2018 | Spring 2019 |
| Fall 2019 | Spring 2020 |
| Fall 2020 | Spring 2021 |
| Fall 2021 | Spring 2022 |
| Fall 2022 | Spring 2023 |
| Fall 2023 | Spring 2024 |